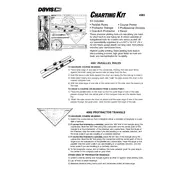
Davis 083 Instruction Manual


To set up the Davis 083 Charting Kit, begin by assembling the tripod and attaching the sensor suite. Connect the data logger to your PC via the USB cable, install the WeatherLink software, and follow the on-screen instructions to initialize the system.
Calibrate the sensors by performing a manual comparison with known standards. For temperature, use a calibrated thermometer. For humidity, a hygrometer can be used. Adjust the sensor readings through the WeatherLink software settings.
Check the USB connection and ensure the drivers are installed correctly. Restart the WeatherLink software and verify that the data logger is powered. If issues persist, consult the user manual for advanced troubleshooting steps.
Regular maintenance includes cleaning the sensor suite, checking for obstructions, verifying sensor accuracy, and updating software. Inspect cables and connections for wear and tear.
Yes, data can be exported from the WeatherLink software in CSV and XML formats, allowing for analysis in spreadsheet applications or other data processing tools.
Connect the data logger to your PC and open the WeatherLink software. Navigate to the firmware update section and follow the instructions to download and install the latest firmware.
First, verify the calibration of the sensors. Check for environmental factors affecting the sensors and ensure they are clean and unobstructed. If problems persist, perform a software reset.
To extend the wireless range, consider using repeaters or relocating the console to a higher position for better line-of-sight with the sensor suite. Check for potential sources of interference.
When storing the Davis 083 Charting Kit, clean all components, remove batteries, and place the equipment in a dry, temperature-controlled environment. Use the original packaging for added protection.
Charts generated by the WeatherLink software display data trends over time. Familiarize yourself with the axis labels and legends to understand parameters such as temperature, humidity, and wind speed.